A purity number is a piece of paperwork, and paperwork is a format. This article is about the four documents that get called “proof of quality” on this market, what each one actually measures, and where they stop.
1. The chromatogram: a count, not a name
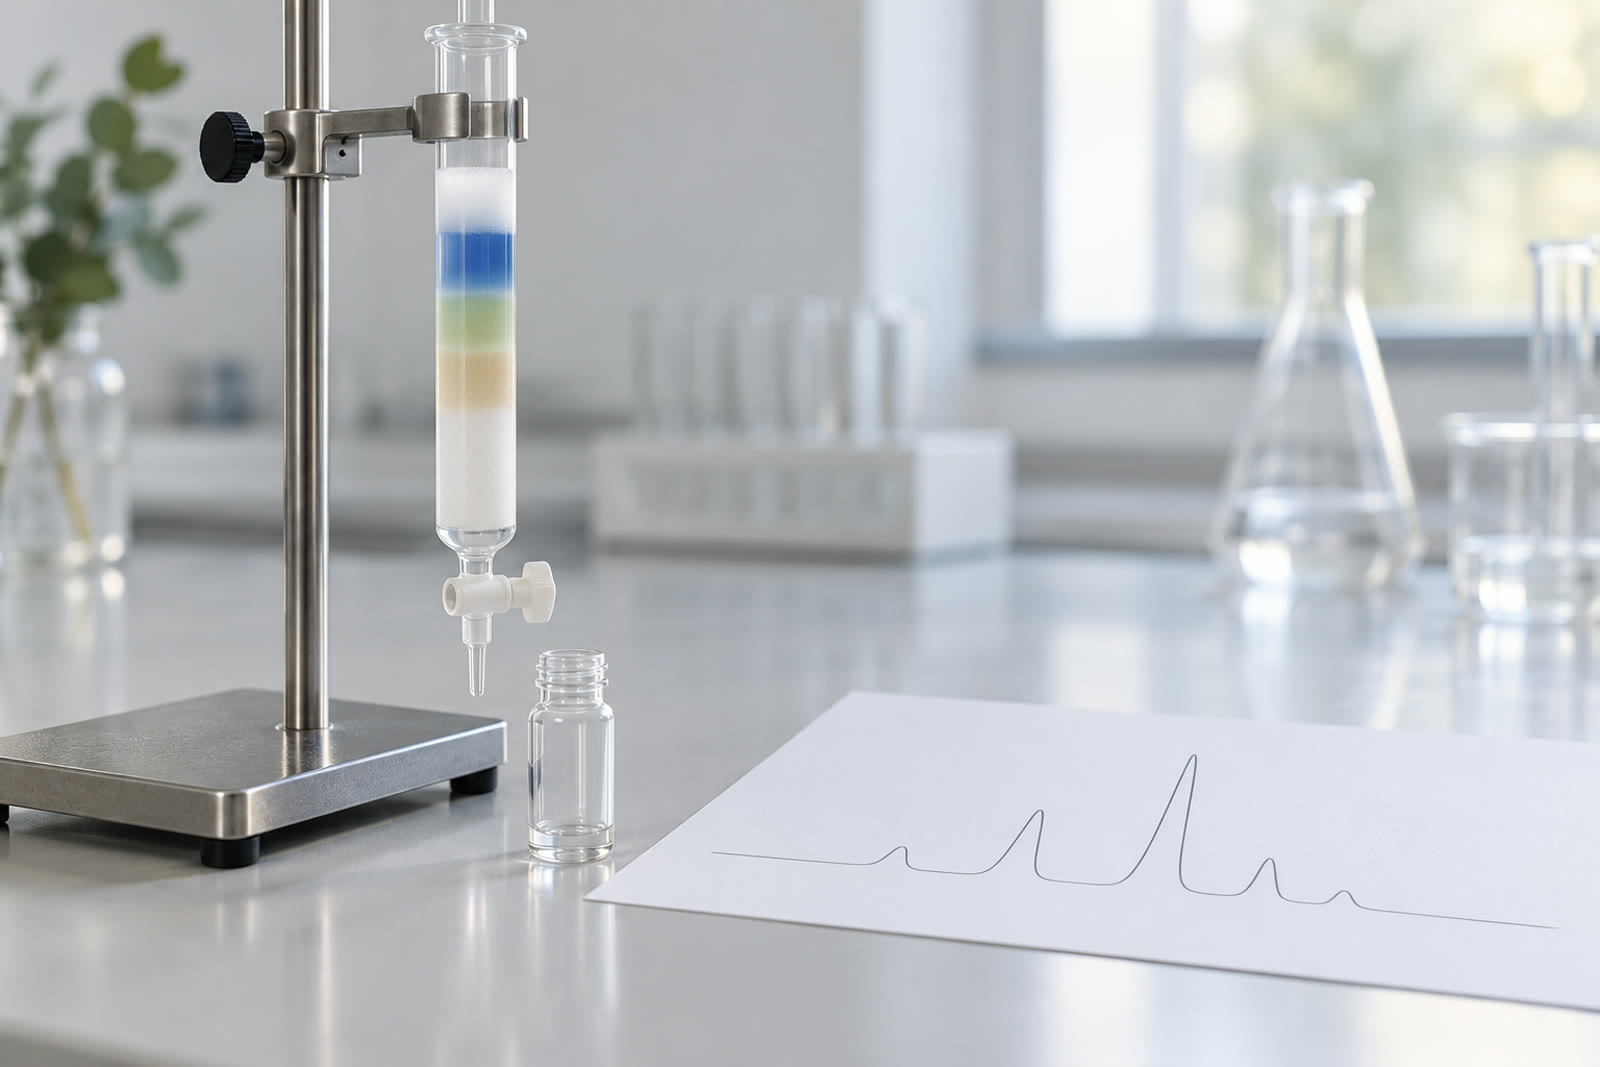
High-performance liquid chromatography separates what comes off a column and reports the area under each peak as a percentage. That is the number printed on most certificates: 98 per cent purity. What it is not is an identification. A peak is a retention time. Two different molecules can share one, and the area percentage tells you the proportion of the signal that came from the main peak — nothing about whether that peak is the compound named on the label.
The literature on this is not subtle. A 1999 paper in Combinatorial Chemistry & High Throughput Screening analysed randomly chosen samples from parallel syntheses and found that the yields of the expected molecules were unexpectedly low for most samples. Its conclusion is the sentence to remember when reading any purity claim: LC-MS was superior to HPLC with absorbance detection, or mass spectrometry alone, for determining the identity and purity of each desired compound.
Three words carry the weight there. Identity first. A chromatogram does not do identity, and adding a mass spectrometer is what turns a percentage into a claim about a molecule.
2. Mass spectrometry: identity, and a different purity
Mass spectrometry works by measuring mass-to-charge ratios, so it answers “is this the mass I expect?” A paper on de novo sequencing of an unknown protein shows what a full identification workflow looks like: Edman degradation to read the N-terminus, high-resolution MS with collision-induced dissociation to generate fragmentation spectra, sequence tags deduced from those spectra and used to search the NCBI and UniProt databases, and then validation by targeted MS/MS. In that study 24 per cent of the sequence was confirmed by targeted MS/MS and an additional 41 per cent was tentatively assigned by data-independent MS.
That split is the honest way to read any mass-spectrometric confirmation: a fraction is proven, a larger fraction is inferred. A vendor certificate that reports a single “identity confirmed” figure is compressing two different epistemic states into one word.
The purity number that comes with a mass-spectrometric assay is also not the chromatographic purity number. Different separation, different detection, different integration rules.
3. Peptide mapping: what a modern release test looks like
The most rigorous version of this family of methods is described in a 2025 paper on the multi-attribute method, where LC-MS peptide mapping is proposed as a replacement for multiple conventional HPLC and capillary electrophoresis based purity and impurity assays for release and stability testing. The requirement it sets out is the useful part: the method needs a new peak detection function that reliably identifies new, absent and changed peptide species — the ones a conventional assay is designed to miss, because it is looking for known peaks.
Thresholds were rationally designed and the workflow validated against ICH Q2 guidelines. The performance claim is specific and checkable: it recognises relevant peptide species below 1 per cent relative abundance without reporting false positive peaks. That is a very different standard from “the main peak is 98 per cent”, because it is about the part of the sample nobody is selling you.
4. Endotoxin: a different test, with its own failure modes
An endotoxin number comes from the bacterial endotoxin test, usually the limulus amebocyte lysate assay. It is easy to overlook that it is a completely separate measurement from purity, with a separate failure mode.
A 2013 comparison of LAL methods in protein solutions found that measurement of low levels of bacterial lipopolysaccharides can be a challenge because of interference from the inherent properties of the protein, its formulation, or other substances present — and because the expression system may carry endotoxin species distinct from the standard. Results:
- Endotoxin levels were relatively stable in frozen storage, with variation between 1 and 38 per cent among aliquots.
- Between laboratories, variation was not significantly different when the same procedure was followed by trained analysts.
- Most testing modalities gave results within a 50 to 100 per cent variation, generally regarded as within assay variability.
- About 25 per cent of samples showed significant differences between testing modalities and/or reagents.
A 1997 paper adds the other half of the problem: LAL is activated not only by bacterial endotoxins but by certain glucans, and commercial reagents vary highly in their response to those glucans — which is the mechanism behind conflicting inter-laboratory results.
So a clean endotoxin certificate is a good sign, and a clean one is not the same as an exact one. A walkthrough of how to read a purity report covers what the fields on the document actually mean.
The five questions worth asking a certificate
- What method produced the number? HPLC alone answers a different question from LC-MS. If the method is not stated, the number cannot be interpreted.
- Is purity separated from identity? A percentage with no mass confirmation is a chromatographic area.
- What was the reference standard, and from where? A peak assigned against a vendor-supplied standard is only as good as the standard.
- What is the detection floor? Anything below roughly 1 per cent is usually outside what a conventional assay reports at all.
- Is there a separate endotoxin result, and by which method? And if there is interference, was it addressed rather than ignored.
What these documents do not show
- They do not show the method was validated for this specific peptide. All the validation work cited is on protein biopharmaceuticals, not on small synthetic peptides sold for research.
- They do not show stability over time. Purity on the day of testing says nothing about what the vial looks like after storage and transport.
- They do not show absence of every impurity. A method has a detection floor, and the floor differs between methods; a clean result at 1 per cent is not a clean result at 0,01 per cent.
- They do not transfer between suppliers. Purity, retention and identity are properties of a sample in a document, not of a compound name.
- They do not show the assay was performed by anyone independent. A certificate generated by the party that filled the vial is a different kind of document from a third-party report, and the paperwork often does not distinguish the two.
Read the document for what it measured, not for the number at the top. The number is the easy part; the method line under it is the whole story.